Multi-Dimensional Scaling
Overview
Multidimensional scaling (MDS) is a family of techniques for exploring similarities or dissimilarities among items. An MDS algorithm starts with an item–item proximity matrix and assigns each item a location in a low-dimensional Euclidean space. For two or three dimensions, the resulting layout can be plotted directly for information visualization and exploratory analysis.
SMILE’s MDS algorithms live in smile.manifold. The package provides classical MDS (MDS), Kruskal’s nonmetric MDS (IsotonicMDS), and Sammon’s mapping (SammonMapping).
The major types of MDS algorithms include:
| Type | Description |
|---|---|
| Classical multi-dimensional scaling | Takes an input matrix of dissimilarities between pairs of items and outputs a coordinate matrix whose configuration minimizes a loss function called strain. |
| Metric multi-dimensional scaling | A superset of classical MDS that generalizes the optimization to a variety of loss functions and weighted distance matrices. A common loss is stress, often minimized by stress majorization. |
| Non-metric multi-dimensional scaling | Finds both a non-parametric monotonic relationship between dissimilarities and Euclidean distances, and the locations of items in the low-dimensional space. The relationship is typically recovered by isotonic regression. |
| Generalized multi-dimensional scaling | Extends metric MDS so the target space may be an arbitrary smooth non-Euclidean manifold. When dissimilarities are distances on one surface and the target is another, GMDS finds a minimum-distortion embedding between surfaces. |
Classical Multi-dimensional Scaling
Classical multidimensional scaling is also known as principal coordinates analysis. Given a matrix of dissimilarities (for example pairwise distances), MDS finds points in a low-dimensional space that well-approximate those dissimilarities. Any dissimilarity measure may be used; when the input is Euclidean distances, classical MDS is equivalent to PCA.
The proximity matrix must be non-negative and symmetric, with zeros on the diagonal. For pairwise distances, pass the plain distances — not squared distances. The result is a record with scores(), proportion() of variance, and coordinates().
Hyperparameters are fields of the nested MDS.Options record. Pass an Options instance to fit, or a java.util.Properties map using the keys below (Options.toProperties() / Options.of(props) round-trip). Convenience constructor new MDS.Options() uses d = 2 and positive = false.
import smile.manifold.MDS;

MDS model = MDS.fit(proximity);
MDS model2 = MDS.fit(proximity, new MDS.Options(2, true));
double[][] x = model2.coordinates();
double[] scores = model2.scores();
double[] prop = model2.proportion();
import smile.manifold._
val model = mds(proximity, 2)
val model2 = mds(proximity, 2, positive = true)
val x = model2.coordinates
val scores = model2.scores
val prop = model2.proportionimport smile.manifold.*
val model = mds(proximity, 2)
val model2 = mds(proximity, 2, positive = true)
val x = model2.coordinates()
val scores = model2.scores()
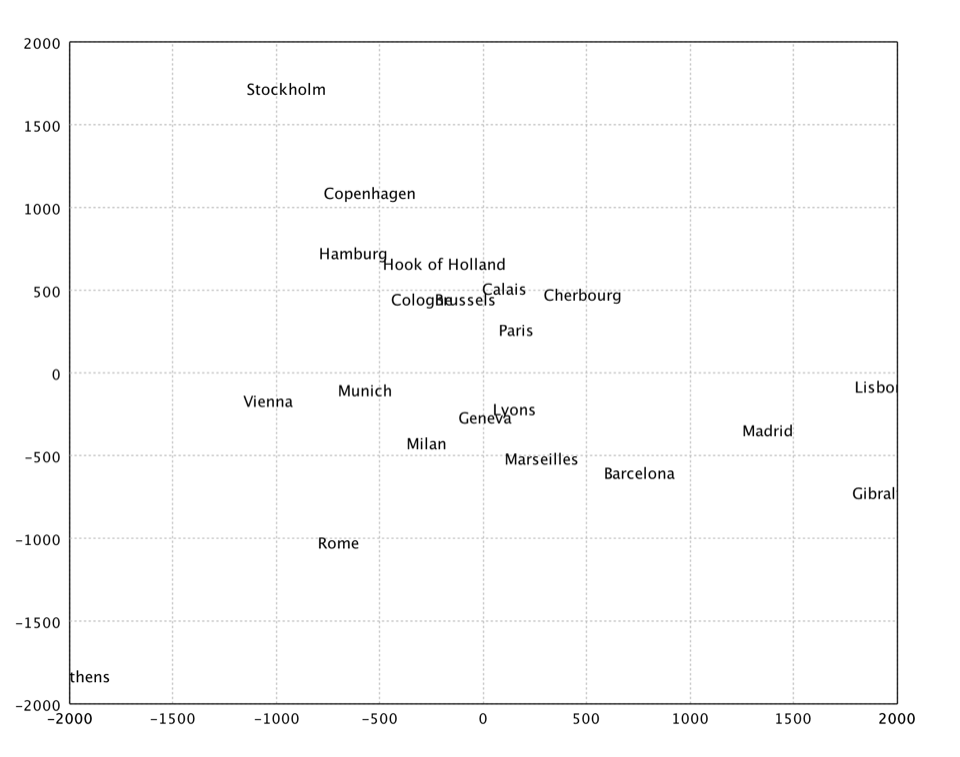
val prop = model2.proportion()The following example embeds European cities from a tabulated distance matrix (data/mds/eurodist.txt: tab-delimited, first column city names, remaining columns the distance matrix).
import smile.io.Read;
import smile.manifold.MDS;
import smile.plot.swing.TextPlot;
import org.apache.commons.csv.CSVFormat;

var eurodist = Read.csv("data/mds/eurodist.txt",
    CSVFormat.DEFAULT.withDelimiter('\t'));
var dist = eurodist.drop(0).toArray();
var citys = eurodist.column(0).toStringArray();
var x = MDS.fit(dist, new MDS.Options(2, true)).coordinates();
TextPlot.of(citys, x).canvas().window();
// TextPlot.of(citys, x).canvas().window()
(opens plot: classical MDS of European cities)
import smile.manifold._
import smile.plot.swing.TextPlot
import smile.read

val eurodist = read.csv("data/mds/eurodist.txt",
  delimiter = "\t", header = false)
val dist = eurodist.drop(0).toArray()
val citys = eurodist.column(0).toStringArray()
val x = mds(dist, 2, positive = true).coordinates
TextPlot.of(citys, x).canvas.window
// TextPlot.of(citys, x).canvas().window()
(opens plot: classical MDS of European cities)
import smile.io.Read
import smile.manifold.*
import smile.plot.swing.TextPlot
import org.apache.commons.csv.CSVFormat

val eurodist = Read.csv("data/mds/eurodist.txt",
    CSVFormat.DEFAULT.withDelimiter('\t'))
val dist = eurodist.drop(0).toArray()
val citys = eurodist.column(0).toStringArray()
val x = mds(dist, 2, positive = true).coordinates()
TextPlot.of(citys, x).canvas().window()
// TextPlot.of(citys, x).canvas().window()
(opens plot: classical MDS of European cities)
Kruskal's Nonmetric MDS
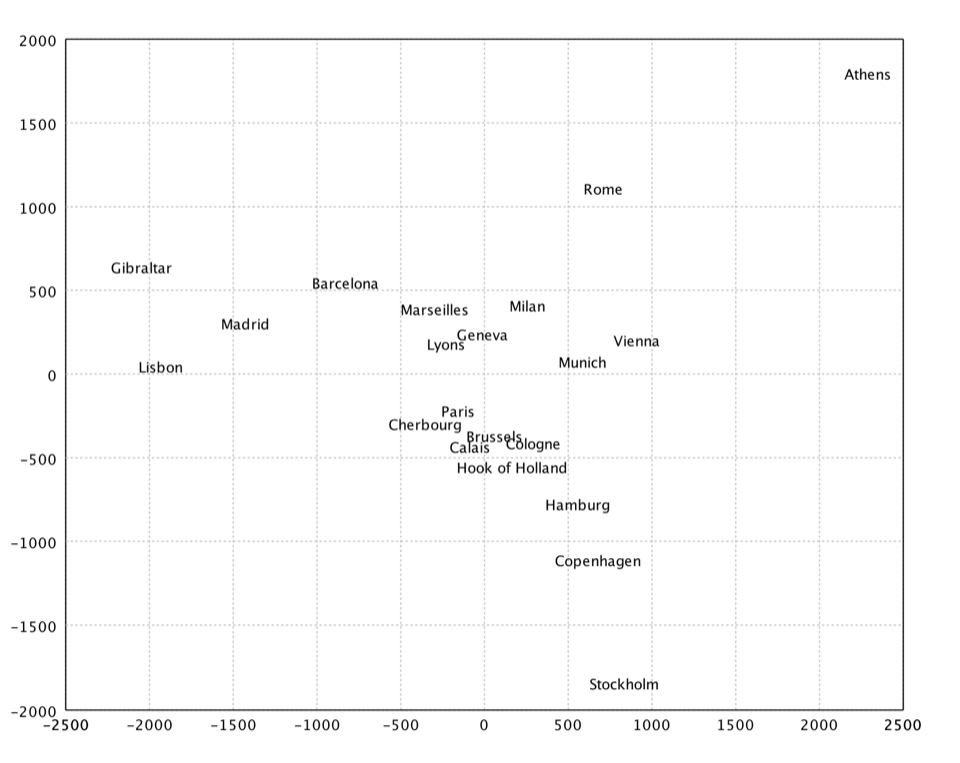
Kruskal’s nonmetric MDS (IsotonicMDS) assumes that only the rank order of entries in the proximity matrix carries significant information — not the numeric dissimilarities themselves. The final configuration should preserve that rank order as far as possible. A perfect ordinal rescaling into distances is usually impossible; the monotonic relationship is recovered by isotonic regression.
The result exposes stress() (the objective value) and coordinates(). Fitting starts from a classical MDS initialization when no custom start is supplied.
Hyperparameters are fields of the nested IsotonicMDS.Options record. Pass an Options instance to fit, or a java.util.Properties map using the keys below (Options.toProperties() / Options.of(props) round-trip). Default constructor new IsotonicMDS.Options() uses d = 2, tol = 1E-4, maxIter = 200.
import smile.manifold.IsotonicMDS;

IsotonicMDS model = IsotonicMDS.fit(proximity);
IsotonicMDS model2 = IsotonicMDS.fit(proximity,
    new IsotonicMDS.Options(2, 1E-4, 200));
double stress = model2.stress();
double[][] x = model2.coordinates();
import smile.manifold._
val model = isomds(proximity, 2)
val model2 = isomds(proximity, 2, tol = 1E-4, maxIter = 200)
val stress = model2.stress
val x = model2.coordinatesimport smile.manifold.*
val model = isomds(proximity, 2)
val model2 = isomds(proximity, 2, tol = 1E-4, maxIter = 200)
val stress = model2.stress()
val x = model2.coordinates()import smile.io.Read;
import smile.manifold.IsotonicMDS;
import smile.plot.swing.TextPlot;
import org.apache.commons.csv.CSVFormat;
var eurodist = Read.csv("data/mds/eurodist.txt",
CSVFormat.DEFAULT.withDelimiter('\t'));
var dist = eurodist.drop(0).toArray();
var citys = eurodist.column(0).toStringArray();
var x = IsotonicMDS.fit(dist).coordinates();
TextPlot.of(citys, x).canvas().window();
// TextPlot.of(citys, x).canvas().window()
(opens plot: Kruskal's nonmetric MDS)
import smile.manifold._
import smile.plot.swing.TextPlot
import smile.read

val eurodist = read.csv("data/mds/eurodist.txt",
  delimiter = "\t", header = false)
val dist = eurodist.drop(0).toArray()
val citys = eurodist.column(0).toStringArray()
val x = isomds(dist, 2).coordinates
TextPlot.of(citys, x).canvas.window
// TextPlot.of(citys, x).canvas().window()
(opens plot: Kruskal's nonmetric MDS)
import smile.io.Read
import smile.manifold.*
import smile.plot.swing.TextPlot
import org.apache.commons.csv.CSVFormat

val eurodist = Read.csv("data/mds/eurodist.txt",
    CSVFormat.DEFAULT.withDelimiter('\t'))
val dist = eurodist.drop(0).toArray()
val citys = eurodist.column(0).toStringArray()
val x = isomds(dist, 2).coordinates()
TextPlot.of(citys, x).canvas().window()
// TextPlot.of(citys, x).canvas().window()
(opens plot: Kruskal's nonmetric MDS)
Sammon's Mapping
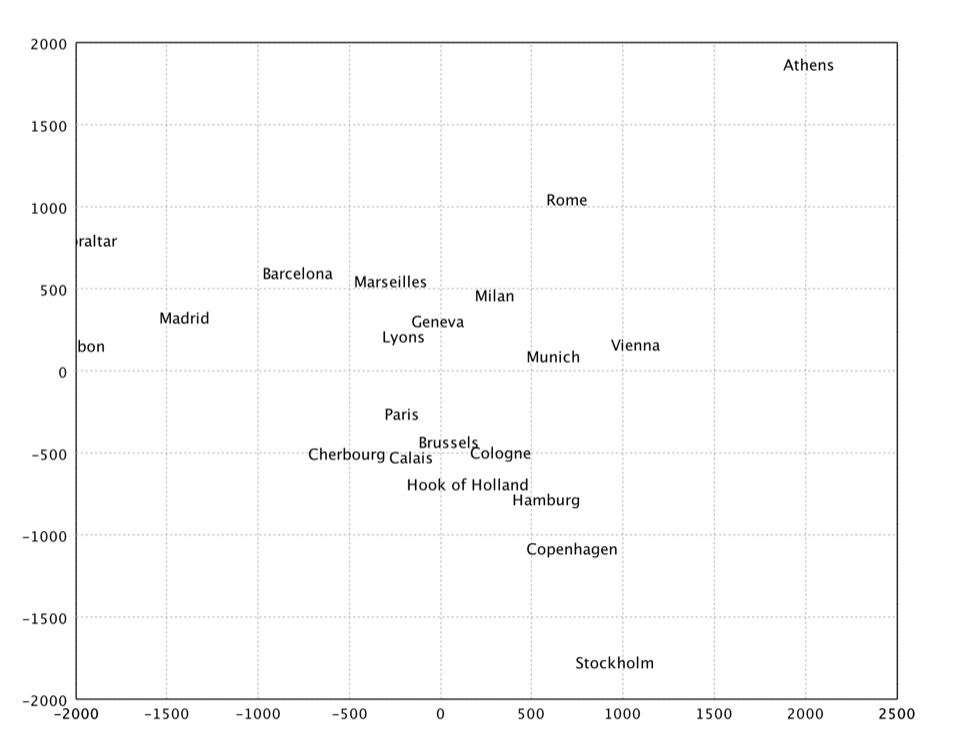
Sammon’s mapping is an iterative technique that makes interpoint distances in the low-dimensional projection as close as possible to those in the high-dimensional object. Points that are close together should remain close; points that are far apart should remain far apart. It is a special case of metric least-squares multidimensional scaling.
Ideally a projection would be geometrically congruent to the original figure — an isometric embedding. That is rarely possible in lower dimensions, so Sammon’s algorithm minimizes differences between corresponding interpoint distances. A second goal is to preserve topology by putting greater stress on smaller distances. Whenever an isometric projection exists, Sammon’s mapping recovers it; otherwise it reduces distance distortion while limiting topological change.
The embedding has no closed-form solution. Sammon suggested gradient descent; Kohonen’s heuristic is simple and works reasonably well. SMILE’s SammonMapping.fit(proximity) defaults to d = 2 and step size 0.2. The result exposes stress() and coordinates().
Hyperparameters are fields of the nested SammonMapping.Options record. Pass an Options instance to fit, or a java.util.Properties map using the keys below (Options.toProperties() / Options.of(props) round-trip). Convenience constructor new SammonMapping.Options(d, step, maxIter) uses tol = 1E-4, stepTol = 1E-3, and no controller.
import smile.manifold.SammonMapping;

SammonMapping model = SammonMapping.fit(proximity);
SammonMapping model2 = SammonMapping.fit(proximity,
    new SammonMapping.Options(2, 0.2, 100));
double stress = model2.stress();
double[][] x = model2.coordinates();
import smile.manifold._
val model = sammon(proximity, 2)
val model2 = sammon(proximity, 2, step = 0.2, maxIter = 100)
val stress = model2.stress
val x = model2.coordinatesimport smile.manifold.*
val model = sammon(proximity, 2)
val model2 = sammon(proximity, 2, step = 0.2, maxIter = 100)
val stress = model2.stress()
val x = model2.coordinates()import smile.io.Read;
import smile.manifold.SammonMapping;
import smile.plot.swing.TextPlot;
import org.apache.commons.csv.CSVFormat;
var eurodist = Read.csv("data/mds/eurodist.txt",
CSVFormat.DEFAULT.withDelimiter('\t'));
var dist = eurodist.drop(0).toArray();
var citys = eurodist.column(0).toStringArray();
var x = SammonMapping.fit(dist).coordinates();
TextPlot.of(citys, x).canvas().window();
// TextPlot.of(citys, x).canvas().window()
(opens plot: Sammon's mapping)
import smile.manifold._
import smile.plot.swing.TextPlot
import smile.read

val eurodist = read.csv("data/mds/eurodist.txt",
  delimiter = "\t", header = false)
val dist = eurodist.drop(0).toArray()
val citys = eurodist.column(0).toStringArray()
val x = sammon(dist, 2).coordinates
TextPlot.of(citys, x).canvas.window
// TextPlot.of(citys, x).canvas().window()
(opens plot: Sammon's mapping)
import smile.io.Read
import smile.manifold.*
import smile.plot.swing.TextPlot
import org.apache.commons.csv.CSVFormat

val eurodist = Read.csv("data/mds/eurodist.txt",
    CSVFormat.DEFAULT.withDelimiter('\t'))
val dist = eurodist.drop(0).toArray()
val citys = eurodist.column(0).toStringArray()
val x = sammon(dist, 2).coordinates()
TextPlot.of(citys, x).canvas().window()
// TextPlot.of(citys, x).canvas().window()
(opens plot: Sammon's mapping)